Additional content for our customers
In addition to the freely available Budapest Housing Market Report, for our customers we offer additional analytical insights on various topics, ranging from marketability of retail spaces through the optimization of amenities for new residential developments to the optimal choice of service charges for shared blocks.
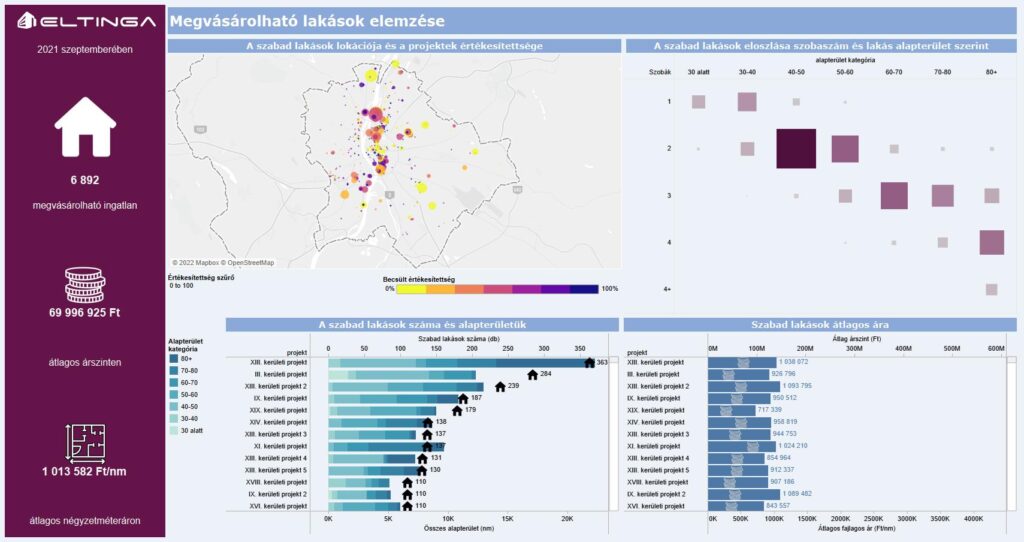
Based on our New Homes Survey, we also offer bespoke dashboarding solutions built in the industry-standard visualizing tool Tableau.
This sample dashboard depicts new projects in 2017Q4:
We offer our dashboards in two flavours, both depicting the new supply of the latest quarter and transactions from the previous quarter. Our dashboards feature the exact location of the projects, the distribution of current supply and units sold by floor space and number of rooms plus transaction from the previous quarter. In addition to Budapest, they can be used to gain insights on other regions/areas.
This sample uses an anonymized version of our database to give a visual overview of the supply of new residential construction in 2022Q3.